USER STORY
Mapping HIV prevalence hotspots: Overcoming the dual burden of data scarcity and spatial interpolation challenges
One of the biggest global public health threats known to humanity is the Human Immunodeficiency Virus (HIV) epidemic. The Joint United Nations Programme on HIV/ AIDS (UNAIDS) estimated that the number of people living with HIV (all ages) increased from 33.3 million in 2010 to 36.7 million in 2015. South Africa has a high generalised HIV epidemic with pockets of high HIV burden areas. In addition, with nearly 3.4 million people on treatment, South Africa is home to the highest number of people living with HIV on treatment in the world. The South African National AIDS Council (SANAC) is responsible for co-ordination of a multi-sectoral HIV Prevention response for South Africa.
Challenge
• Visualise areas where HIV prevalence is particularly high, based on selected indicators
• Prevention specific data is scanty and an alternative, robust data source was
identified as HIV testing. Although HIV testing is not in itself, a prevention service, it is linked to impactful services
Solution
A rights-based, evidence-informed, and community-owned HIV Prevention response.
Benefits
• Represent data that is usually difficult to sift through in raw format
• Spatially interpolate relationships between health care facilities
• Providing key decision making information to health care service providers regarding the prevalence of HIV in their area of responsibility.
The Challenge
Addressing the impact of HIV on South Africa requires a clear understanding of structural drivers/vulnerabilities such as poverty, sexual debut and intergenerational sex as well as the level or type of exposure of individuals or certain communities to the risk of infection. Structural drivers’ relation to HIV prevalence in a certain area necessitates insight into the “underlying behaviour that place people at greater risk of HIV exposure” iii. A targeted approach to high HIV burden mapping can inform the design and implementation of tailored HIV prevention programmes that address specific patterns of structural and behaviour risk that influences HIV prevalence (percentage of people tested in a specific group who is infected with HIV). In South Africa there are substantial differences between high and low HIV prevalence districts and even among populations within a specific district. For example, during 2013 in South Africa, the lowest HIV prevalence of 2.3% was recorded in Namaqua district in the Northern Cape and the highest prevalence of 45.9% in iLembe district, KwaZulu-Natal iv – a significant difference of more than 43%. There are also distinct differences in HIV prevalence among age groups in South Africa, ranging from 2.4% in the 0-14 year group to 25.2% in the 25-49 year group. The variations in HIV prevalence for different geographies and populations require different approaches in HIV responses. Among others, spatial representation of hot versus cold spots using selected indicators of HIV prevalence are hypothesized to assist in the identification of localised areas of HIV risk and vulnerability, that would inform the design of specific services and interventions. Analysing the outcome of the spatial interpolation of data that is collected routinely at health care facility-level could therefore further assist health system planners and implementers to sharpen, adjust and maximise HIV responses to achieve more effective and efficient health care programmes for optimally designed HIV prevention, care and treatment packages.
The Solution
The SANAC Secretariat is developing a rights-based, evidence-informed, and community-owned HIV Prevention response that uses a mix of biomedical, behavioural, and structural interventions for a geographically focused strategy that is prioritised to meet the current HIV prevention needs of particular individuals, key population groups and communities, so as to have sustained impact on reducing new HIV infections in South Africa.
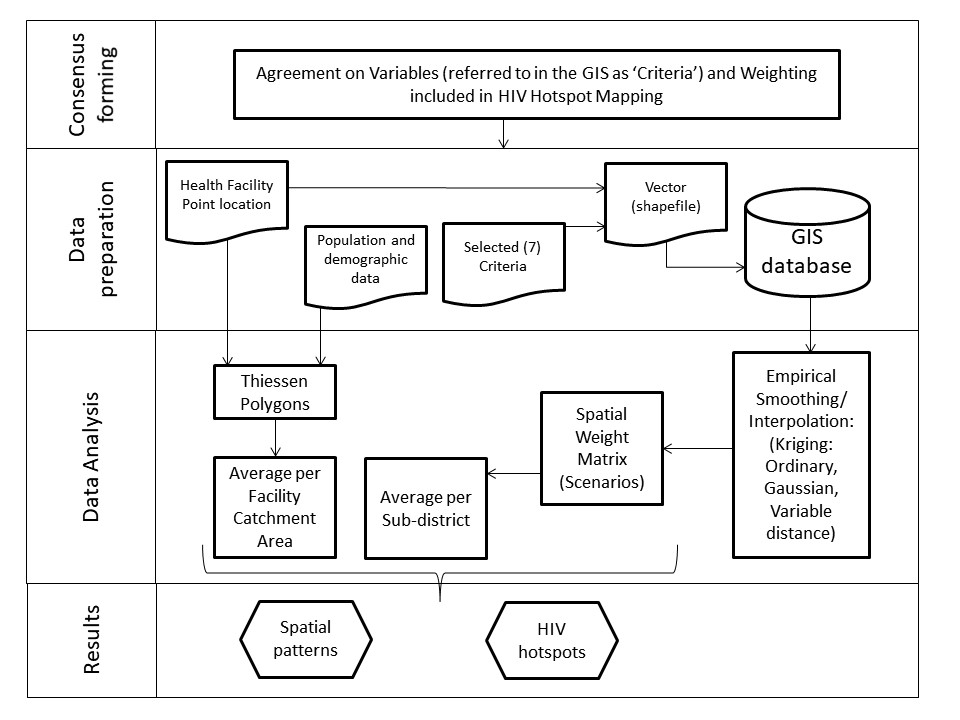
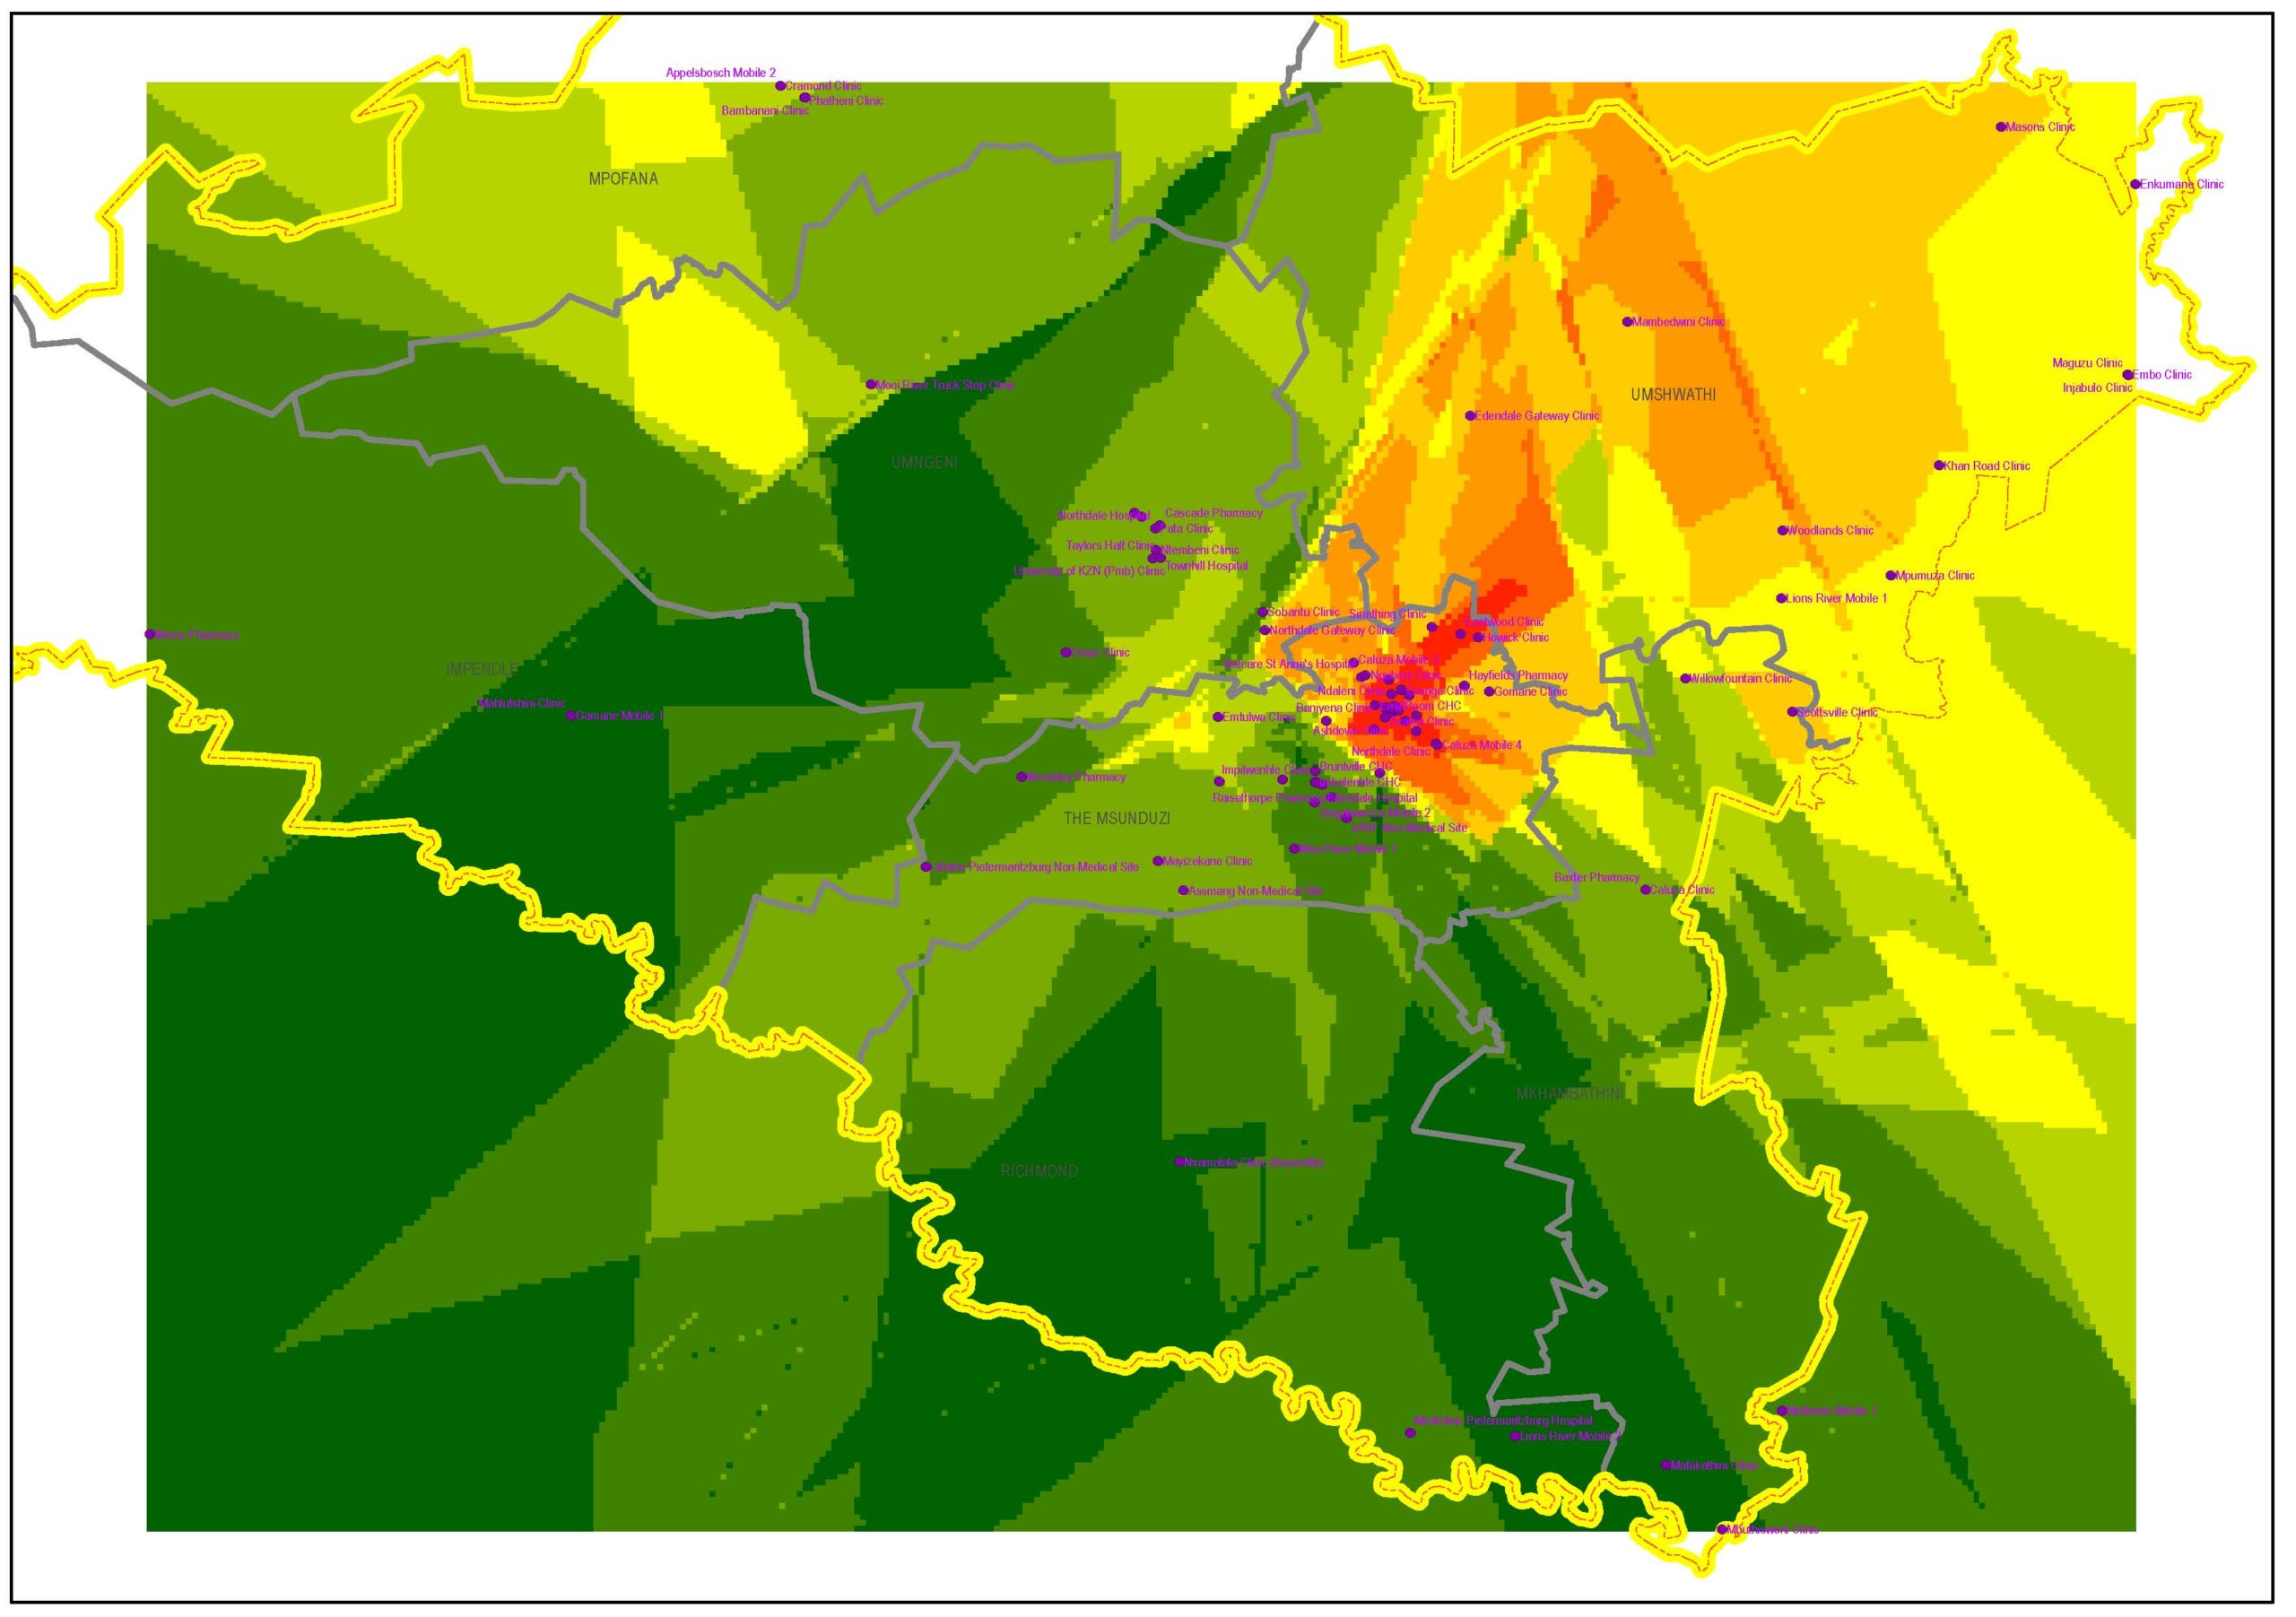
In support of the HIV response, SANAC created a platform for a transparent multisectoral, locally informed and user-friendly approach to HIV hotspot mapping as the first step towards the development of the HIV Prevention response. SANAC in conjunction with other partners piloted a spatial interpolation method that involves selection of specific HIV prevalence indicators/criteria, and visualising the output per sub-district. The method and details are presented in the diagram below. Esri South Africa standard ArcGIS tools were used to manipulate the raw data and build a geodatabase using the selected criteria. The interpolation was done using Spatial Analyst Extension tools, and the final spatial representation per sub-district again engaged standard ArcGIS software. The model was built in the model builder tool, enabling easy updates and changes to the model, and ensuring that the output can be reproduced when new data for the same criteria becomes available via health facilities. In addition, the model enables new criteria to be added in the same manner as the piloted ones, thus allowing a multitude of additional HIV prevalence indicators to be added. Routine data collected at health facility level was used to generate shapefiles for each criterion. Thereafter, spatial interpolation was done to interpolate data for all locations across the study area, regardless of the distance that any point may be located from a health facility. At this time features such as topography, rivers and roads are not considered in the modelling method – something that would indeed be advantageous to include in future methods. The interpolation tool used in this instance generated rectangular polygon outputs, interpolating the facility-level selected routine data across the entire spatial area and allocating an interpolated value to each raster cell.

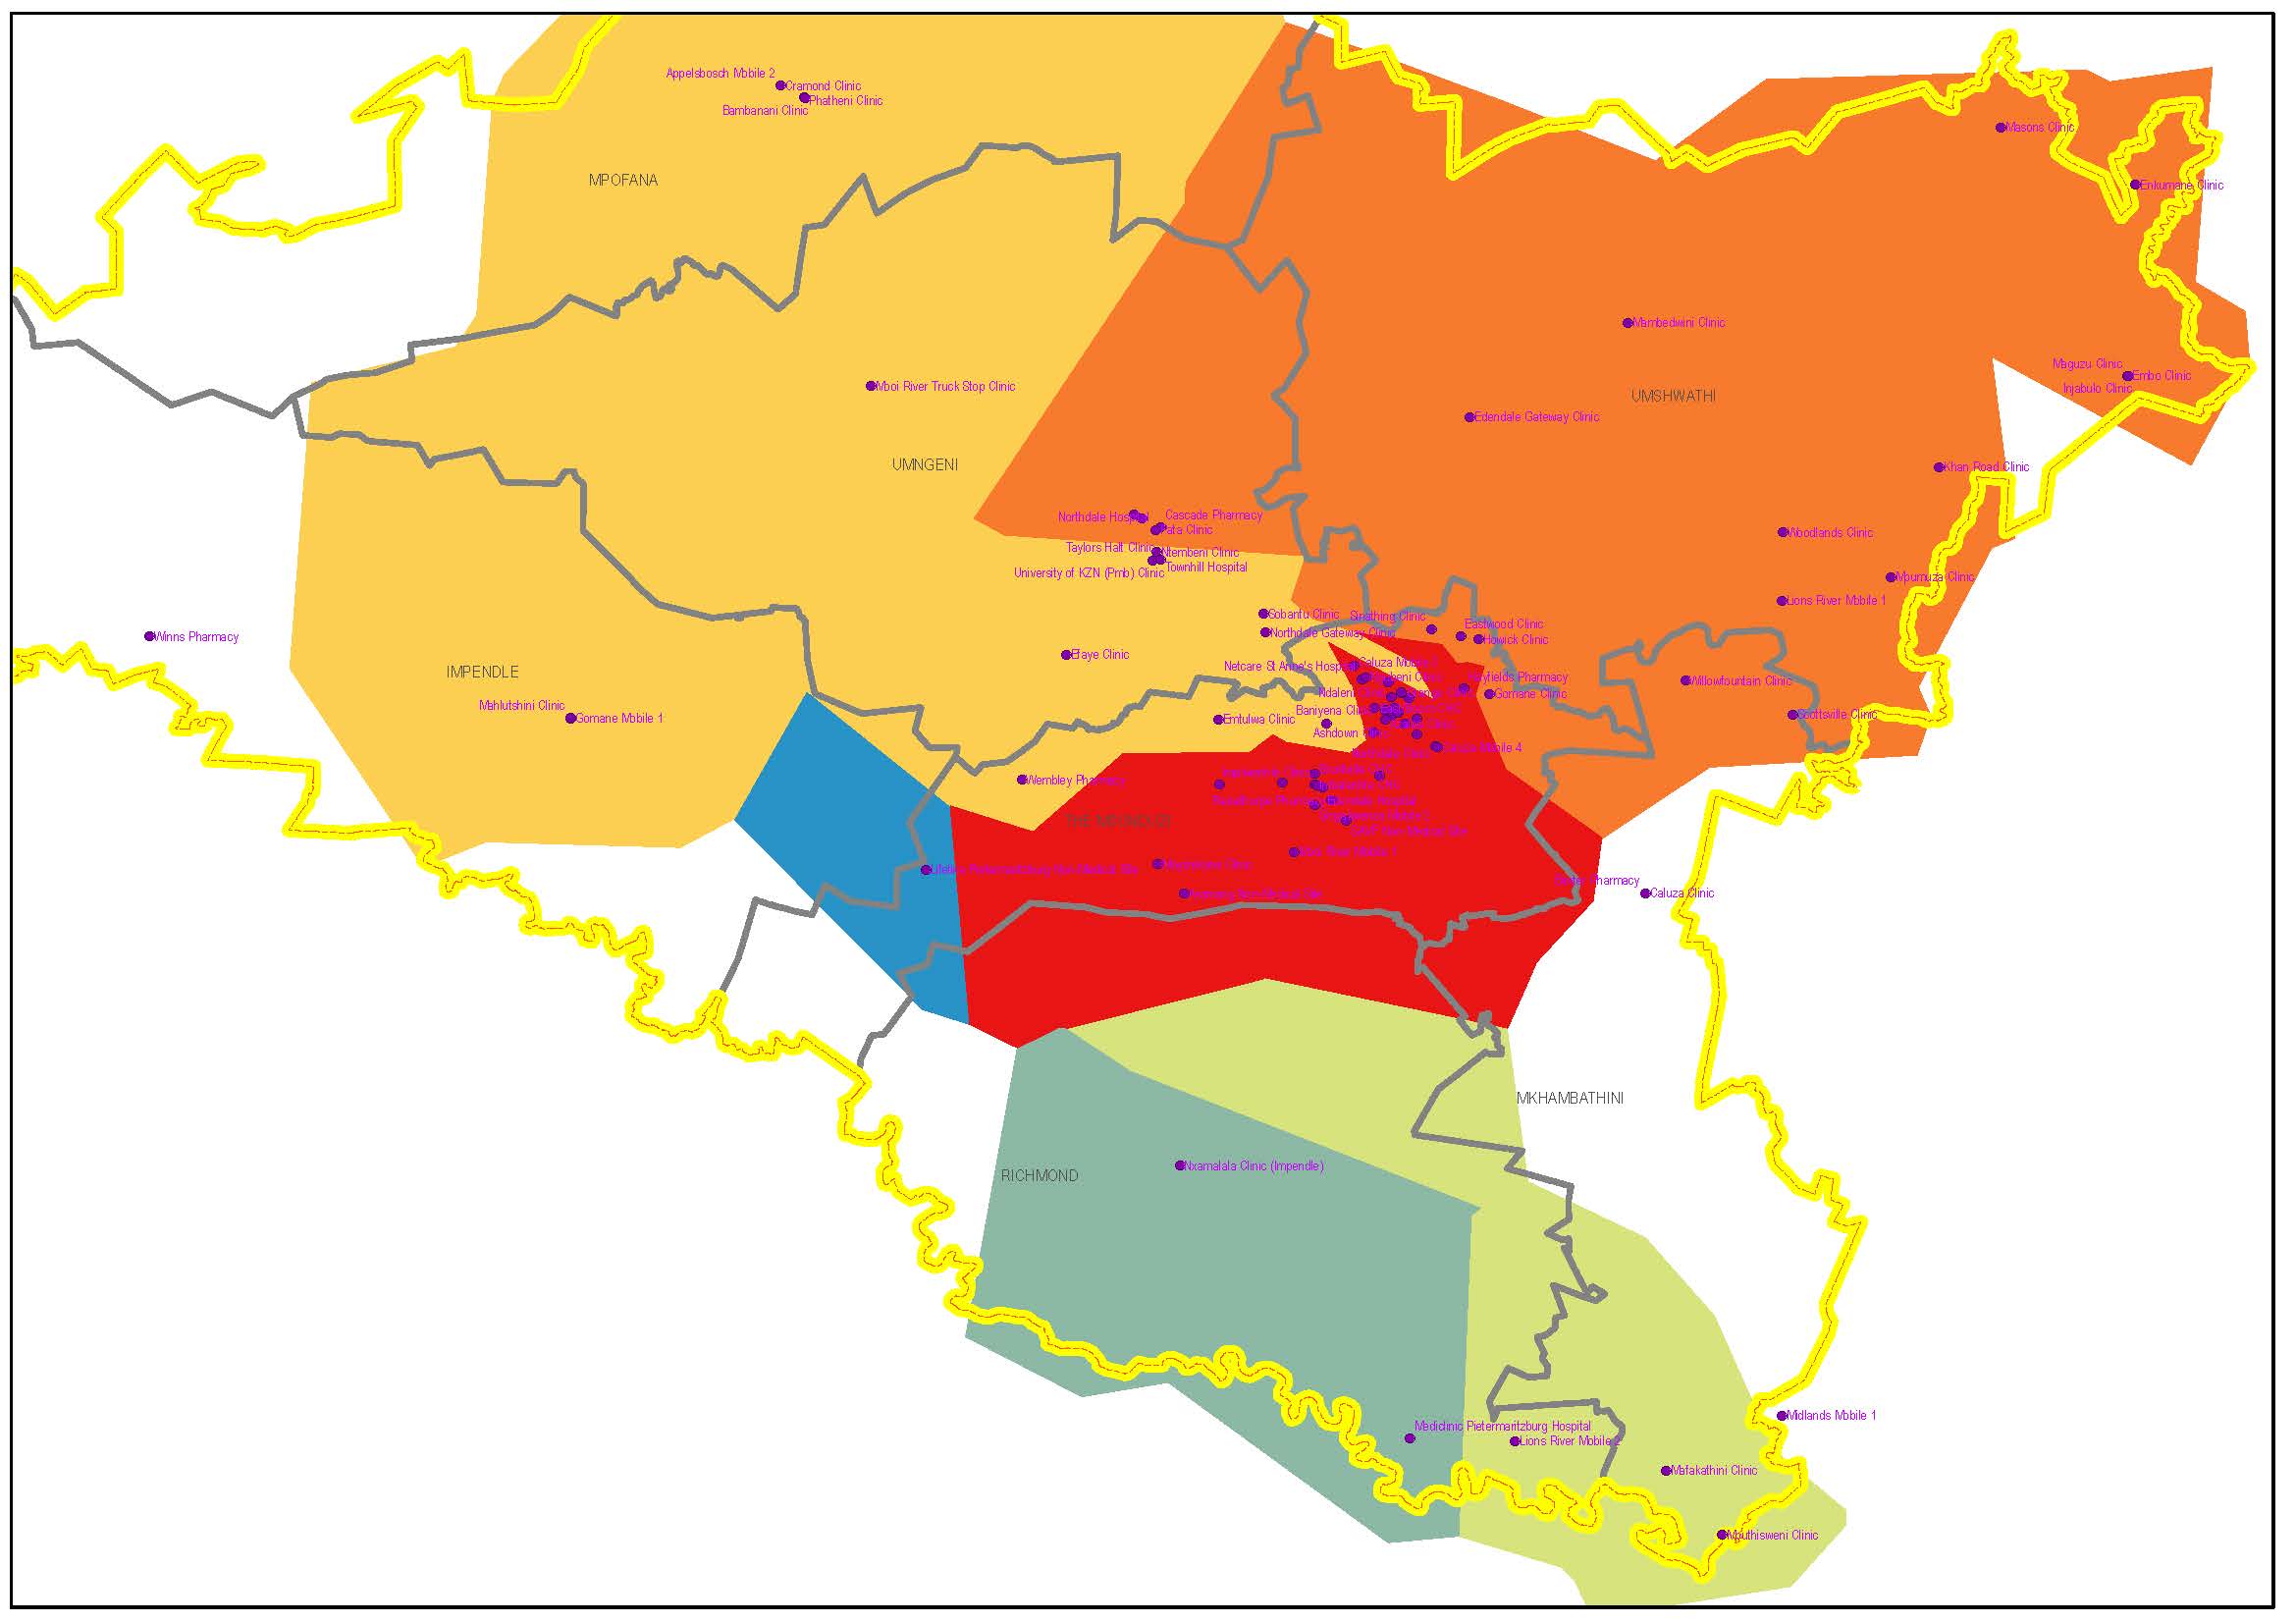
The model allows the resultant interpolated spatial data layers to be allocated different weightings, which changes the outcome of the criteria on a user-defined basis. In this way, decision makers who use the model would be able to create their own unique scenarios based on the selection of similar or differences in the level of importance of the selected criteria. Finally, visualisation of the weighted scenarios can be done using any selected spatial overlay boundary dataset such as health facility catchment areas, sub-districts, districts or even at provincial level. This is again done using standard ArcGIS tools.
Benefits
The pilot study tested and proved the relevance of using routinely collected data at health facilities to visualize HIV hotspots. Although data remain scarce in some areas and for some indicators, it is indeed possible to visualise the areas and especially sub-districts where HIV positivity is high and where there would be specific specialist care needs. In addition, the pilot study showed that it is possible to use a variety of interpolation tools to represent the information but that some methods and parameters used in the interpolation process is more feasible and provides an improved output than others – for example Ordinary Kriging using Gaussian parameters at a variable distance are in this instance more suitable to use than Universal Kriging or Fixed radius distances. A key outcome of the model is that user interaction with regard to the weighting of data layers (i.e. HIV prevalence indicators) is possible, thus allowing customization of the output. This hotspot approach assists decision makers and health care managers to take informed decisions based on a location-specific (hotspot) considering evidence of actual HIV burden. An unintended positive consequence of the modelling process is that areas where the hotspot maps shows deviation from what is anticipated to be the true situation on the-ground can be identified – this means that there may be a challenge with data collection or resource allocation at health facilities. In addition, the results would thus assist in enabling more targeted and detailed data collection, thus in future enabling improved data collection – since it is the raw data that drives the output. Not only does this approach assist in the optimum allocation of limited resources it also ensures that the most impact is achieved and future data collection methods and
processes can be improved.
Criteria used to determine HIV positivity for this pilot project
• Infant 1st PCR (polymerase chain reaction) test positive around 6 weeks rate
• Infant rapid HIV test around 18 months positive rate
• HIV test positive child 12-5 months rate
• HIV test positive child 5-14 years rate
• Antenatal client HIV 1st test positive rate
• HIV prevalence amongst client tested 15-49 years rate

Scenario results show areas of hot (red) vs cold (green) spots, based on different layers weighted individually using Kriging.

Authors: Rousseau CPJ, Storie JM, Du Toit LE, Abdullah F and Slingers N
UNAIDS, Global AIDS update, 2016.
UNAIDS, Global AIDS update, 2016.
UNAIDS, Local Epidemics Issues Brief, 2014.
The National Antenatal Sentinel HIV prevalence Survey, 2013, South Africa. National Department of Health, 2015
Shisana, O, Rehle, T, Simbayi LC, Zuma, K, Jooste, S, Zungu N, Labadarios, D, Onoya, D etal.
(2014) South African National HIV Prevalence, Incidence and Behaviour Survey, 2012. Cape Town, HSRC Press.
UNAIDS/WHO Working Group on Global HIV/AIDS and STI Surveillance 2013.
C Beyrer et al.: A Call to Action for Concentrated HIV Epidemics. Current opinion in HIV and AIDS, 2014.
