USER STORY
Evidence-based practice: Using GIS to guide HIV service provision
Anova Health Institute is a Non-Profit Organisation headquartered in Johannesburg, South Africa with projects in all nine provinces of the country. Anova was established in 2009 and is dedicated to improving the health of the South African public based on the core values of Excellence, Trust, People, Innovation and Expertise. The organisation is an important partner to the Department of Health, strengthening the public healthcare system through technical assistance and capacity building. This is made possible through the financial support of the United States Agency for International Development (USAID), the President’s Emergency Plan for AIDS Relief (PEPFAR) and various other donors.
Challenge
Identifying where to focus HIV diagnostic and treatment services
Solution
Using GIS to identify areas with large gaps in service provision
Benefits
• Using GIS to visualise service provision allows easy identification of areas with the greatest gap in care where services are most needed
• GIS is a key component of evidence-based decision making, guiding service delivery and resource allocation for effective programme management
The Challenge
The human immunodeficiency virus (HIV) invades a person’s immune system which is life-threatening if left untreated, as the body becomes increasingly susceptible to infections and disease. HIV-infection can be effectively treated using antiretroviral therapy (ART), a combination of drugs which suppresses replication of the virus and prevents progression of HIV-related disease. Those living with HIV can live a productive and healthy life if they obtain these drugs and adhere to treatment protocols. Anova supports the South African Department of Health in rolling out HIV care, including diagnostic and ART services, both of which have been dramatically scaled up throughout the country, reaching millions of HIV-infected people each year. As increasing numbers of people living with HIV access ART, it becomes progressively more difficult to know where to focus these services in order to find those people infected with HIV who have not yet been diagnosed or initiated on treatment. Our challenge was to develop an effective method to guide diagnostic and treatment service provision so as to increase the likelihood of finding those people living with HIV who have not yet been identified by and included in the ART programme.
The Solution
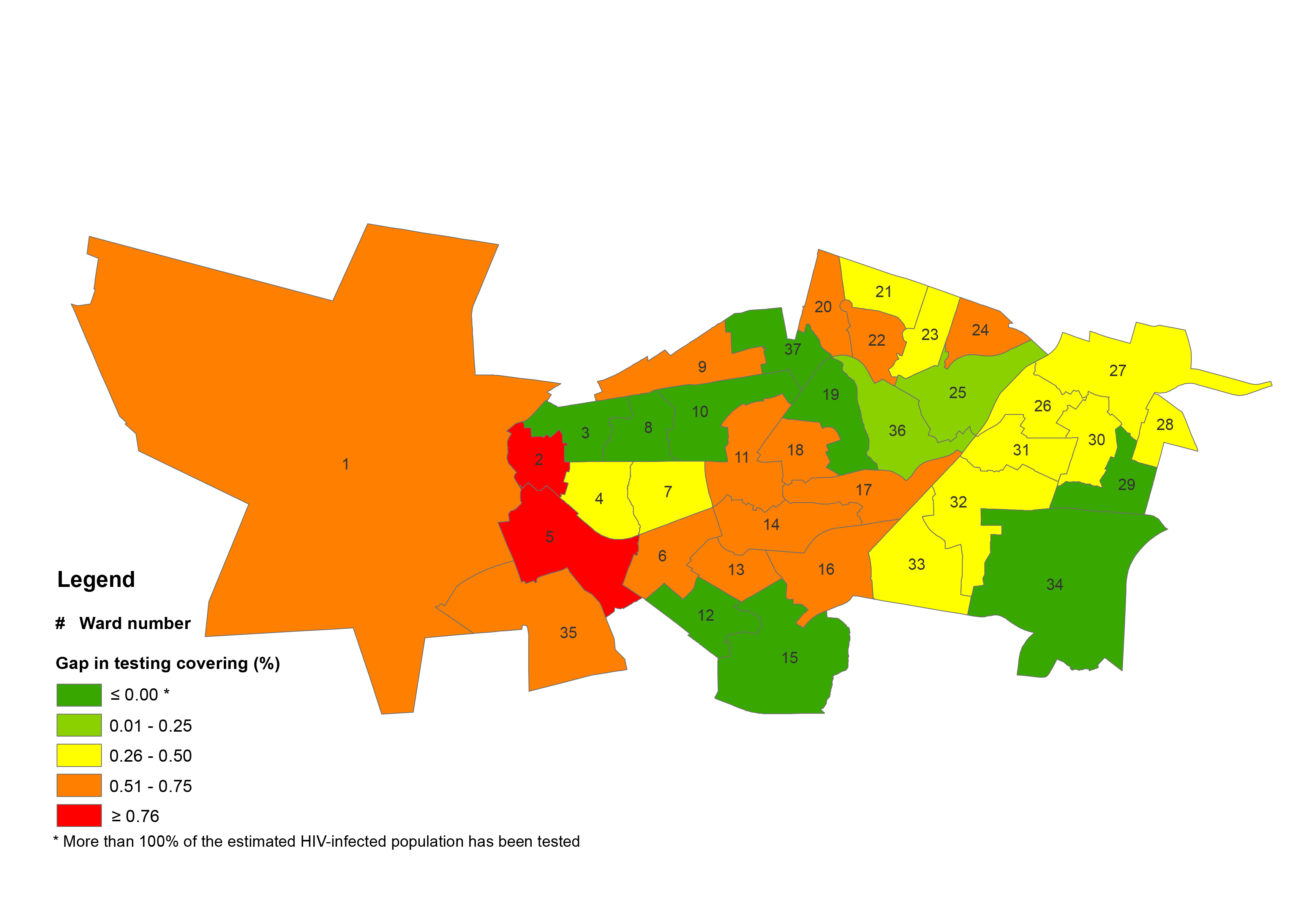
Maps showing locations of healthcare facilities and ward boundaries were used to identify catchment areas served by each facility. The HIV-infected population in a particular facility’s catchment area was then estimated using population data and HIV prevalence rates obtained from publicly available sources. The number of people accessing HIV testing and ART services at the facility, obtained from routine monitoring and evaluation data, was compared to the estimated HIV-infected population in the facility’s catchment area in order to estimate the proportion of people living with HIV who accessed testing or treatment services in the area. This was visually represented using a map to highlight areas with the greatest gap in service provision where large numbers of HIV-infected individuals may not have been diagnosed or initiated on treatment. These areas need to be targeted to receive intensified services, for example, expanding clinic-based services into the community through mobile clinics or alternative ART distribution points.
Spatial patterns of HIV testing and treatment uptake monitored at a programme level can thus guide service provision by easily identifying areas that require targeted interventions to close gaps in testing or treatment coverage.
Sample map demonstrating HIV testing coverage by ward
Using GIS to symbolise the HIV testing coverage gap by ward clearly highlights wards in red that have the greatest gap in service coverage. A similar map can be generated for ART coverage by ward.

